Introduction to DNA Methylation Analysis
In this introduction, we’ll cover what DNA methylation is, where it occurs, how we measure it, and common methods for cleaning/pre-processing data before analysis. At the end of this introduction, we also provide a list of papers, videos, and documentation pages that provide more detail on these topics than we can go into in this quick primer.
Introduction
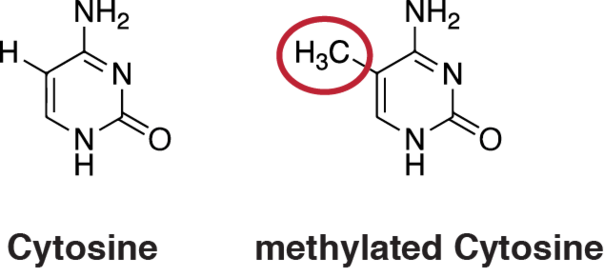
DNA methylation occurs when a methyl group (CH3) is transferred to the C5 position of a cytosine base. This is a mechanism for gene regulation. Methylation can be a signal for the cell to recruit inhibiting proteins. The methyl group can also prevent transcription factors from binding to DNA, thus preventing transcription factors from upregulating the affected gene.
So where does methylation commonly occur?
The human genome has areas which have a high ratio of CG basepairs. These GC-rich regions are known as CpG islands (Cytosine-phosphate-Guanine), or CGIs. These regions are generally 500-1500bp with >60% GC-content. CpGs are not to be confused with CG basepair bonds. A CpG island references the nucleotides in sequence and on one strand of DNA (linked by the phosphodiester bond, hence the p in CpG), not a C linked to a G in a basepair bond. See the example below, which shows a CpG site on the left and a CG basepair bond on the right.

CGIs tend to be in the promoters of genes and usually contain the 5’ end of the transcript. In mammals, it is estimated that 70-80% of cytosines in CGIs are methylated. Unmethylated CpG islands are typically associated with active promoter regions [1].
However, CpG islands are not the only places where methylation occurs. Differential methylation has also been observed in the “shores,” “shelves,” and the “open sea” (these terms are the names of regions that are varying distances from the CpG islands) [2]. Shores are up to 2kb from the CpG island and shelves are from 2kb to 4kb from the CpG island. The open sea refers to isolated regions that do not have a specific designation. See figure below.

Methylation also plays an important role in cellular development by silencing some genes and shaping the pathway the cell uses to differentiate itself. The unique and stable methylation patterns of various types of tissue have been documented, but differential methylation has also increasingly been studied in several diseases in recent years [[3], [4], [5]]. DNA methylation occurs over time in normal, healthy cells as a response to environmental stimuli. Another important note is that methylation is reversible, and there is ongoing research into how lifestyle changes can affect methylation patterns in the genome [6].
Measuring Methylation
One of the common methods of measuring DNA methylation is a methylation array, and the most commonly used arrays are manufactured by Illumina. Illumina has released several array types for humans–27k, 450k, EPIC, and EPIC+–as well as a mouse array. (methylsuite supports all human and mouse arrays, with options for custom arrays as well). 450k arrays have been discontinued; 90% of the probes that were on 450k arrays are covered by the new EPIC array. The EPIC+ array covers all of the EPIC and 450k probes, in addition to double coverage on some probes of interest for quality control purposes.
These arrays make use of bisulfite sequencing to detect whether specific CpG loci are methylated. With bisulfite sequencing, methylated cytosines are unaffected. Unmethylated cytosines are converted to uracil and then a thymine. So in the new DNA sequence, instead of an unmethylated cytosine, there is a thymine. See below for an example.
Original DNA sequence:          A C G A T C G C G A
Bisulfite converted sequence:   A C G A T T G T G A
We see only the first cytosine remains the same after bisulfite conversion, so we can assume that that particular C is methylated. We can also assume the other two cytosines at the end of the sequence are unmethylated because they were converted to thymines. However, it has been observed that most CpG loci are “in phase” with each other: if one locus is methylated, there is a high probability that the nearby CpG sites are also methylated.
Array Design
Each methylation array is covered in thousands of microwells. Each well houses a silica bead with an oligonucleotide probe targeting a specific DNA sequence. The probe sequence will stop one nucleotide short of the target locus. The target DNA binds to the probe and a fluorescently labelled ddNTP will bind to the end of the sequence, complementing whatever base was present at the target locus (cytosine or thymine). The probes are then excited by a laser and the output frequency is measured.
To confuse things further, there are two types of probes. Both probes are approximately 50bp of target DNA sequence and both types of probe are specific to ONE nucleotide pair’s methylation state. For example, if the probe’s sequence is as follows:
CTACAAATACGACACCCGCAACCCATATTTCATATATTATCTCATTTAAC
We would be evaluating the methylation state of the cytosine in a CpG site immediately following this target sequence.
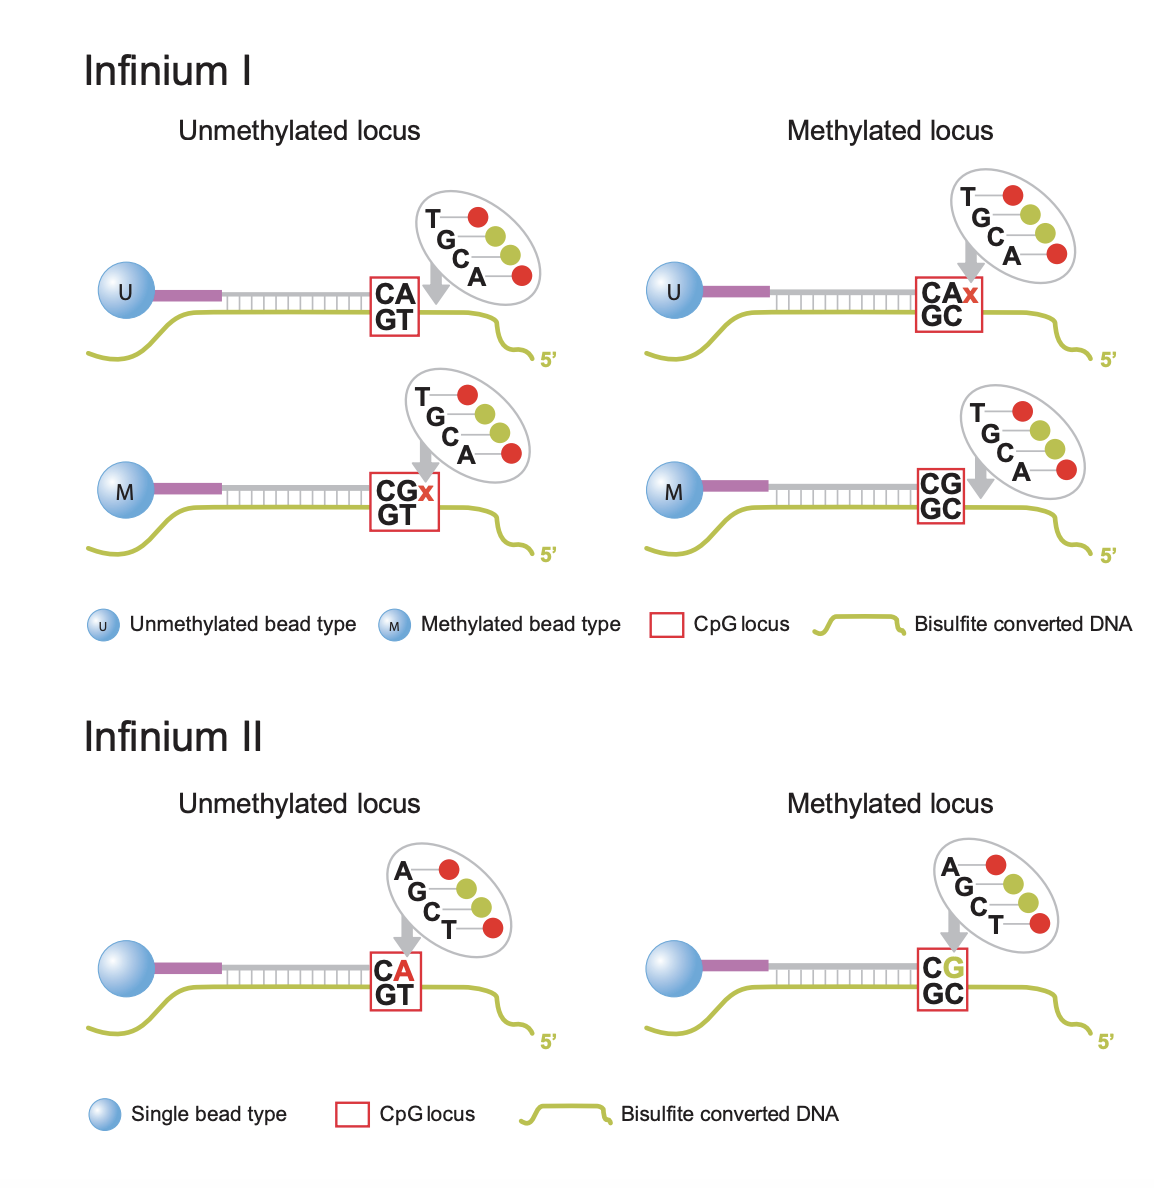
Infinium I: Type I probes require two beads for each locus. One bead type (M) is for the methylated state of that locus. If the cytosine is methylated and does not convert after bisulfite conversion, the M bead will bind at that locus (see top right panel of figure above). However, if the cytosine is not methylated and does convert to a thymine, the second bead type (U) will bind to the thymine (see top left panel of figure above). Type I probes are measured by a single channel. These probes are based on the assumption that CpG methylation is correlated in a 50bp span. Underlying CpG sites (other CpGs in the target DNA sequence that are not the final target CpG) are treated as “in phase” with the target locus. In other words, if we revisit our example probe sequence above, that means we would assume that ALL the CpGs in that sequence are in the same methylation state as the one we targeted.
Infinium II: Type II probes will bind to methylated OR unmethylated bases at the target locus (see bottom panel of figure above). The ddNTP that is incorprated at the end (either an A to match the T for an unmethylated state, or a G to match the C that remains unchanged for a methylated state) will be excited by a laser. Thus, this probe type needs to be measured by two channels (green for methylated, red for unmethylated). Type II probes are more sensitive to underlying CpG sites because the same probe is used to evaluate methylated sequence (where the cytosines are preserved) and unmethylated sequence (where the cytosines are converted to thymines). Thus, type II probes tolerate a maximum of 3 other CpGs in a probe sequence and they will be assigned degenerate “R” bases so that the complimentary target DNA sequence is still able to bind to the probe whether those bases are converted to thymines or not (i.e. regardless of their methylation state). This means that, unlike type I probes, the target locus can be evaluated independently of nearby CpG sites and the “all or nothing” methylation assumption of Type I probes is not applicable.
There is a distinct advantage to the use of type II probes in that they only need one probe per locus, so building an array of type II probes could cover twice as many loci as an array of only type I probes. However, the drawback of type II probes, as covered above, is that they do not function well in regions of high CpG density (such as CpG islands). Also, due to the difference in chemistry, type I probes are considered advantageous for the extremes of methylation states (either completely methylated or completely unmethylated) because the peaks of the beta distribution are spread further apart.
Betas and M-Values
Beta values and M-Values are two ways to measure methylation. Betas are typically easier to interpet, as they range from 0 to 1 and represent the proportion of how many cells had a methylated base for that probe site. We would expect 0’s and 1’s in a perfect experiment (0 for an unmethylated locus and 1 for a methylated locus), but the reality is that technical noise and other types of variation make it very uncommon to encounter either of those scenarios. More often, beta values lie somewhere between 0.1-0.9, and we see a bimodal distribution with peaks at either end of that range when beta values are plotted on one line.
The beta value is calculated with the following formula:
Where and
represent the methylated and unmethylated signals respectively. And
is a constant, typically set to 100, that stabilizes the beta value when both the signals are low.
Note that is sometimes left out of common preprocessing piplines, which results in
being equal to the simple proportion of M/(M+U).
minfi uses Illumina’s recommended constant of 100, while SeSAMe and methylprep both set to 0 by default (although, in the case of
methylprep, users may set minfi=True when processing raw data, which will mimic minfi’s output).
M-values take the ratio of methylated and unmethylated intensities and apply a log transformation. M-values are unbounded, so they can be more difficult to interpret and compare. A value around 0 means that the methylated and unmethylated signals are close to equal. A positive M-value means that the methylated signal is higher, while a negative M-value means that the unmethylated signal is higher.
Where and
represent the methylated and unmethylated signals respectively. And
is a constant, typically set to 1, that stabilizes the M-value when both the signals are low. Again,
methylprep’s is set to 0 by default, to match
SeSAMe’s output.
Beta values have been shown to have heteroscedasticity outside of the middle methylation range (0.2-0.8). Additionally, they are bounded, which means they violate the assumptions of the Gaussian distribution that many statistical models apply. The M-value does not have these challenges, but has a much less intuitive biological meaning. Depending on what analyses are being run, either beta or M-values (or both) may be used. In practice, either value works well. methylsuite focuses on using beta values because they are more intuitive.
Other Important Considerations
background correction, normalization methods, filtering, etc
One of the first processing steps of methylprep is to infer the color channel for type I probes. Recall that type I probes operate on a single color channel. Each probe’s color channel should be provided as part of the manifest file. Occasionally, these manifest files are inaccurate. methylprep will infer and reset the probe’s channel in the manifest based on the actual signals from each channel.
Another issue that arises with multi-channel usage is dye-bias. This is a phenomenon where the red and green channels have different signal intensities. They have to be corrected in order for the rest of the processing pipeline to be accurate. methylprep uses quantile normalization between red and green channels within a sample to correct this. This is also known as a nonlinear method of dye bias correction (comparable to the one SeSAMe uses).
Out-of-band (OOB) probe data is commonly used as part of the preprocessing pipleline. Recall that type I probes utilize only one color channel but have two probes for one locus. The probe that does not match the actual methylation state of the sample still captures a measure of fluorescence that can be used to help estimate background noise. In other words, if a type I probe is operating on the green channel to capture the methylation state of the locus, we will still have flourescence measures from the red channel (and that fluorescence from the red channel is “OOB” data).
There are many ways to normalize methylation data, but the most widely used method is normal-exponential convolution on out of band probes (NOOB). The normal-exponential (normexp) convolution model was developed as part of the RMA algorithm for Affymetrix microarray data (see recommended reading section below for more details on this). The model assumes that the observed intensities are the sum of background noise and true signal components. The background is normally distributed and the signal is exponentially distributed. NOOB is simply using the normexp model on out of band probe data.
Detection P-values are a measure of how likely it is that a given signal is background fluorescence. There are a few methods of calculating these detection p-values. Illumina’s GenomeStudio uses negative control probes in the array to parametrize a Guassian distribution and recommends p-values>0.05 to be excluded. minfi, another popular package for methylation array analysis in R, uses a similar method but with the M and U probes combined into one signal and a background distribution to calculate the Z-score. The background distribution is calculated by combining the color channel(s) of the corresponding probe (type II probes will have both red and green). And they recommend the more stringent exclusion criteria of p-values>0.01 being excluded. SeSAMe and methylprep implement a different method, known as pOOBAH (P value Out Of Band probes for Array Hybridization) where they use the OOB signal of all type I probes to calculate an empirical cumulative distribution function. methylprep users have the option to save pOOBAH values as an output file after sample processing.
Recommended Reading
While we have done our best to give a concise yet detailed introduction that should cover all you need to know to use methylsuite, there is a chance that you are confused (or intrigued) and wish to cover some of these concepts in more detail. Here we provide a few suggested resources:
- For more about CpG Islands see this article
- For more about bisulfite sequencing, see this short video
- For more about methylation arrays, see Illumina’s product sheet or Illumina’s webpages on microarrays
- For more about type I vs. type II probes, see this piece from Illumina
- For more information on beta values and M-values, see this article
- For more information about background correction, here is a helpful video.
- This paper is a good resource to learn more about normalization.
- The paper on the RMA algorithm that was used to develop NOOB is located here here.
methylsuiteis partially modeled after R’s minfi and SeSAMe packages (with expansions and improvements), so their documentation may prove helpful. Also recommended are these two papers that describe SeSAMe and minfi in greater detail.- Dr. Wanding Zhou (SeSAMe’s creator) has published a few other helpful papers, as well. This one includes more information on pOOBAH normalization and this one is a comprehensive characterization of the EPIC and 450k microarrays.
References
- Jung, M., and G. P. Pfeifer. “CpG Islands.” In Brenner’s Encyclopedia of Genetics (Second Edition), edited by Stanley Maloy and Kelly Hughes, 205–7. San Diego: Academic Press, 2013. https://doi.org/10.1016/B978-0-12-374984-0.00349-1.
- Cross, S. H., and A. P. Bird. “CpG Islands and Genes.” Current Opinion in Genetics & Development 5, no. 3 (June 1995): 309–14. https://doi.org/10.1016/0959-437x(95)80044-1.
- Fan, Jian, Jun Li, Shicheng Guo, Chengcheng Tao, Haikun Zhang, Wenjing Wang, Ying Zhang, Dake Zhang, Shigang Ding, and Changqing Zeng. “Genome-Wide DNA Methylation Profiles of Low- and High-Grade Adenoma Reveals Potential Biomarkers for Early Detection of Colorectal Carcinoma.” Clinical Epigenetics 12 (April 21, 2020): 56. https://doi.org/10.1186/s13148-020-00851-3.
- Reinius, Lovisa E., Nathalie Acevedo, Maaike Joerink, Göran Pershagen, Sven-Erik Dahlén, Dario Greco, Cilla Söderhäll, Annika Scheynius, and Juha Kere. “Differential DNA Methylation in Purified Human Blood Cells: Implications for Cell Lineage and Studies on Disease Susceptibility.” PLOS ONE 7, no. 7 (July 25, 2012): e41361. https://doi.org/10.1371/journal.pone.0041361.
- Moss, Joshua, Judith Magenheim, Daniel Neiman, Hai Zemmour, Netanel Loyfer, Amit Korach, Yaacov Samet, et al. “Comprehensive Human Cell-Type Methylation Atlas Reveals Origins of Circulating Cell-Free DNA in Health and Disease.” Nature Communications 9, no. 1 (November 29, 2018): 5068. https://doi.org/10.1038/s41467-018-07466-6.
- Hibler, Elizabeth, Lei Huang, Jorge Andrade, and Bonnie Spring. “Impact of a Diet and Activity Health Promotion Intervention on Regional Patterns of DNA Methylation.” Clinical Epigenetics 11, no. 1 (September 11, 2019): 133. https://doi.org/10.1186/s13148-019-0707-0.